Volume Renderer in GR2Analyst
GR2Analyst uses the latest hardware-based direct volume rendering techniques to produce high quality radar volume displays in real time.
Volume Reflectivity - Tornado
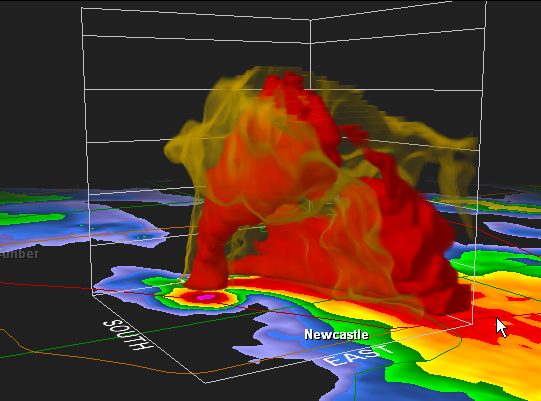
Here's the semi-transparent volume reflectivity for the May 3, 1999 Moore tornado:
The red areas are 50 dbz or greater while the semi-transparent orange areas are 45 dbz. Note the well-defined tube of reflectivity extending down to the center of the hook. Put into motion, you can see how the tube of reflectivity developed and descended to the ground:
This is a classic volume signature for a strong tornado. A large overhang of 50+ dbz develops, a "finger" or descending reflectivity core (DRC) comes out of it, a debris blob appears at the ground level, the DRC connects to the debris blob to form a complete tube.
Volume Storm Relative Velocity - Tornado
While volume reflectivity displays are typically the most useful ones for analyzing a storm's structure, volume base and storm relative velocity can be used to examine the extent of tornadic shear in a cell. Here is the volume SRV in isosurface mode for the March 29, 2000 Ft Worth tornado:
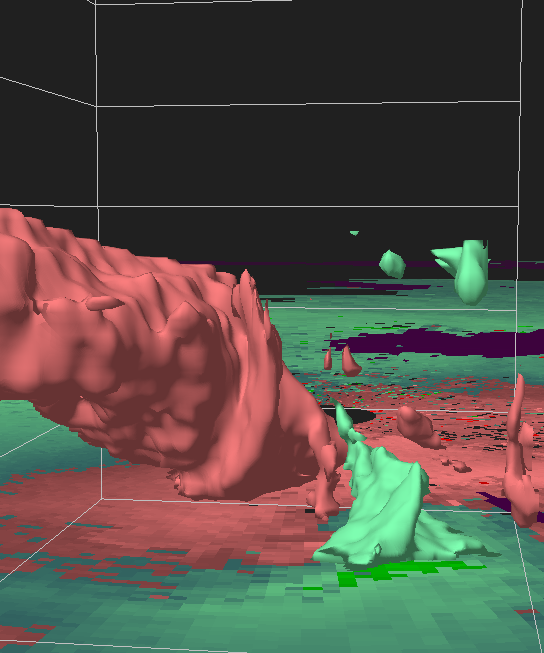
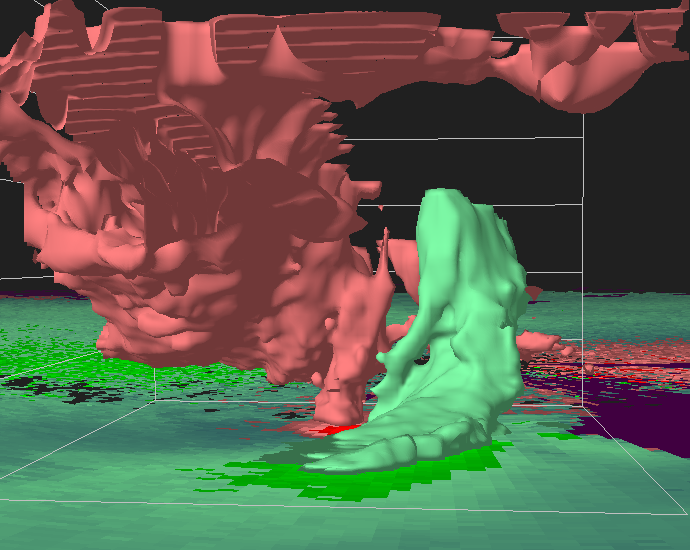
Note how the relatively low altitude inbounds curve into the large outbound region. This is a common feature in strong tornadoes, as you can see in this SRV image from the May 7, 2003 Paducah, KY tornado:
Volume Reflectivity - Hail
GR2Analyst's volume reflectivity display can be used to analyze the development of hail cores in a storm cell. These cores form above the freezing level, which is typically 10,000 ft or more in altitude. We want to look for 60 dbz regions above the freezing level. To do this, we switch to a hail detection volume alpha table that makes 60+ dbz fully opaque and has a semi-transparent "halo" of 50 dbz to let us see the overall shape of the cell. Here is volume reflectivity for the September 22, 2005 hailstorm along the Michigan/Indiana border:
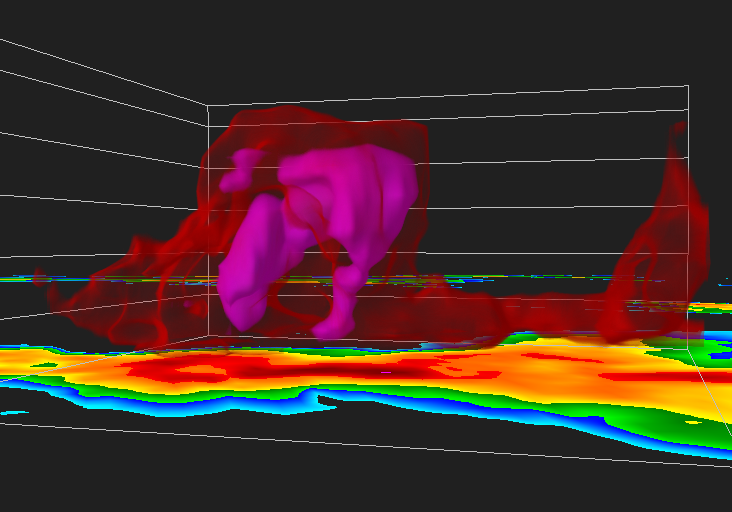
The 60 dbz (purple) hail core is clearly visible within the 50 dbz (red) halo. The core has a rather unusual shape. When we put this hail core into motion, we see how the shape evolved and can make a prediction of where large hail will fail to the ground next:
Now it is clear that there were two hail cores in the still image and that's what produced the unusual shape. The first one was generated by a large updraft that shot straight up to a peak of 40,000 ft and then descended straight down. The strange "fist" shape on the right in the original still image was actually a second hail core under development. It was formed by a very strong, tilted updraft. The 60 dbz region followed an almost ballistic path, as if shot out of a cannon. With the extra information retrieved from the volume animation, we can predict when and where the "ballistic" hail core will hit the ground. Our prediction would be proven correct in this case, as large quantities of 1-2" hail fell in the area where the second core landed. In general, it takes two or three volume scans (10-15 minutes) for a hail core to reach the ground.
In the most extreme hail events, we need to use a hail detection alpha table that isolates even higher reflectivities. Here is a volume reflectivity animation of the May 14, 2003 hail event in southwestern Oklahoma:
In this animation, the solid white areas are 70+ dbz with a halo of purple 60 dbz. Note the explosion of 70+ dbz in a large region of the storm cell. In typical hailstorms, you will see small regions of 70 dbz but large ones like this are rare. As you might expect, this storm produced near record sized hail of over 5".
GR2Analyst's easy-to-use, intuitive volume renderer allows you to examine storm cells in detail and quickly extract qualitative information about possible tornado and/or hail formation. Information that is only available by visualizing the complete cell in 3D. Once you have identified the areas of concern, you can use GR2Analyst's 2D reflectivity-derived products to quantify the threats.